Overall
92.2
Below avg
Metro cost profile · 2024 BEA RPP
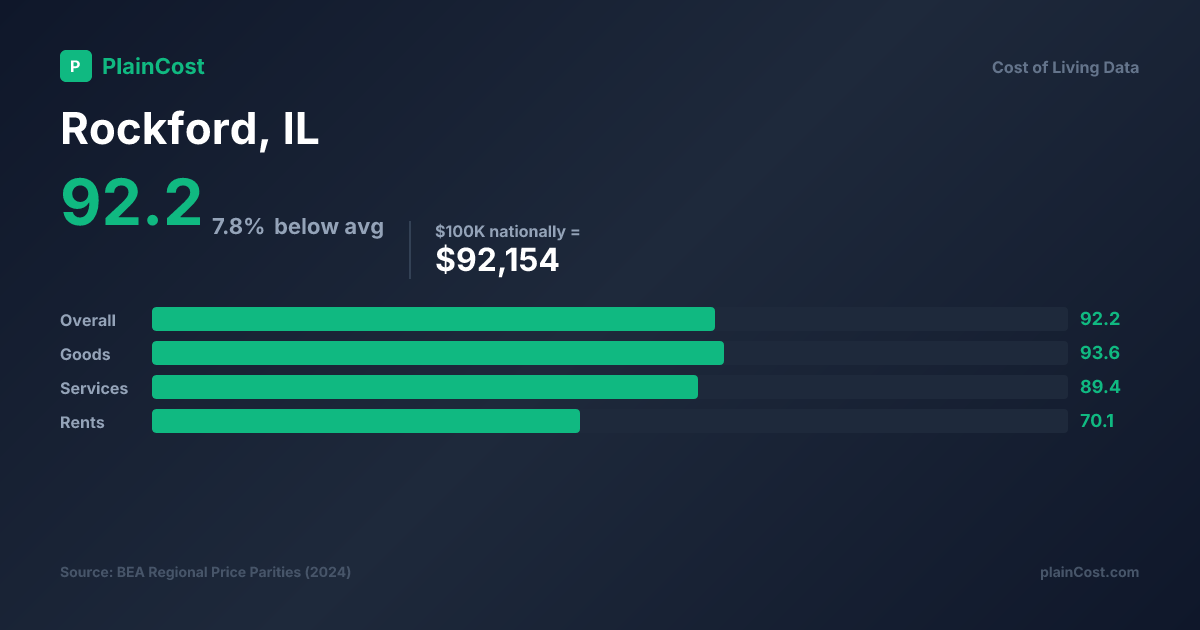
Cost-of-living indicators for Rockford, IL, from Bureau of Economic Analysis Regional Price Parities, overall, goods, services, and rents vs the U.S. average of 100.
Rockford ranks #239 of 387 U.S. metros by cost, and its overall price index has fallen 4.5 points since 2008.
The verdict
Rockford costs less than 62% of U.S. metros, an overall index of 92.2, 7.8% below the national average, with rents the biggest swing at 70.1.
A $100,000 national salary carries the purchasing power of about $108,514 here; matching a $100K lifestyle takes roughly $92,154.
The cost of living has been trending downward, decreasing by 4.5 points over this period. The largest single-year move was in 2010, when the index dropped 3.5 points from the year before.
Every year on record, national average = 100
| Year | Overall |
|---|---|
| 2008 | 96.7 |
| 2009 | 96.6 |
| 2010 | 93.1 |
| 2011 | 93.7 |
| 2012 | 93.9 |
| 2013 | 93.1 |
| 2014 | 93.3 |
| 2015 | 92.5 |
| 2016 | 93.3 |
| 2017 | 91.0 |
| 2018 | 91.1 |
| 2019 | 92.8 |
| 2020 | 91.8 |
| 2021 | 93.2 |
| 2022 | 90.7 |
| 2023 | 90.2 |
| 2024 | 92.2 |
Latest BEA release change
Rockford's overall RPP rose +2.0 points, from 90.2 in 2023 to 92.2 in 2024. The largest category movement was rents, changing from 64.9 to 70.1. This is a relative change against the national benchmark, not a household's dollar bill.
A $100,000 salary at the national average cost of living equals:
in Rockford, IL purchasing power
Use the salary calculator for custom amounts.
How far the median local paycheck goes here, combining income and housing cost
A weighted composite (60% purchasing power, 40% housing affordability) percentile-ranked against every other tracked metro; a missing input redistributes its weight rather than deflating the score. Sources: Census ACS 5-Year 2023 (income) + BEA Regional Price Parities 2024 (cost). Vintages differ by design; see methodology.
Housing-led affordability profile
Housing is the strongest affordability offset in Rockford: rents index at 70.1, the component furthest below the national benchmark. That does not make every local expense low, but it is the clearest explanation for the metro's overall RPP of 92.2.
Across all reported metros, the closest component-profile matches are La Crosse-Onalaska, WI-MN, Appleton, WI, Wausau, WI. They resemble Rockford across goods, services, and rents together, so they are stronger structure peers than a place selected only because its overall RPP happens to be nearby.
Across 2008-2024, Rockford's overall index has fallen by 4.5 points. This is a relative price-level history, not a prediction or a personal affordability recommendation; pair it with current local wages and housing options before making a decision.
Rockford vs every U.S. metro
Where this metro sits in the national cost distribution
92 Bottom 38% higher than 38% of 387 US metros
Each bar is a band; taller bars hold more US metros. The dashed line + filled bar mark this entry. Hover or tap any bar for its full count, share, and where it sits relative to this entry.
Source U.S. Bureau of Economic Analysis, Regional Price Parities · 2024
BEA RPP by category, 100 = national average
Rents
70.1 RPP
Services
89.4 RPP
Overall
92.2 RPP
Goods
93.6 RPP
What this shows Rockford's cost structure is housing-led: rents at 70.1 depart furthest from 100, while services sits at 89.4. This is a rent-sensitive profile, not a claim that every local expense moves together.
Metros near Rockford's overall cost, plotted by their goods price (horizontal) and housing price (vertical). Same headline RPP, very different structures.
Overall
92.2
Below avg
Goods
93.6
Below avg
Services
89.4
Cheap
Rents
70.1
Cheap
IL-relative analysis
Among the 8 IL metros PlainCost tracks with reported goods prices data, Rockford, IL ranks #2 - the 0th percentile within the state. This is a different, narrower cut than the nationwide rank above: it compares Rockford, IL only against its own state's metros, not the full US field.
Ranked by raw value (highest first); a higher rank is not automatically "more expensive is worse", see the national comparison above for direction context. This is a comparison within IL only, not a livability score.
Two BEA RPP-derived peer sets for Rockford, IL: nearest metros by overall regional price parity and by rents RPP. These are cross-state neighborhoods, not the in-state metro list below.
Nearest metros by overall regional price parity (92.2 here).
Nearest metros by rents regional price parity (70.1 here).
View all IL metros → Cheapest in IL → Most expensive in IL →
These metros have an overall RPP closest to Rockford, IL's index of 92.2.
Showing the 6 closest of 387 metro areas tracked nationally.
Decision peers
These metros are closest to Rockford's combined goods, services, and rents profile. They may not have the same overall RPP, but their price pressures are shaped in a similar way.
Shareable data card
Download the data card or share this exact metro record. The card uses the same BEA-derived values shown above.
Cost of living guides →, cheapest and most-expensive metro rankings, salary negotiation with RPP data, and step-by-step comparison walkthroughs.
What this means for Rockford
How to read Rockford's cost of living before a move, a job offer, or a budget.
RPP is BEA's annual price-level benchmark for the data year shown, not a live market quote. Pair it with current local wages and housing costs before deciding.
Rockford, IL has a Regional Price Parity (RPP) index of 92.2, meaning it is 7.8% less expensive than the national average. Goods are indexed at 93.6, services at 89.4, and rents at 70.1. It ranks #239 out of 387 U.S. metro areas by overall cost.
To maintain the same purchasing power as a $100,000 salary at the national average, you would need approximately $92,154 in Rockford, IL. Conversely, $100K earned in Rockford, IL has the purchasing power of $108,514 at the national average.
Rents in Rockford, IL are indexed at 70.1, which is 29.9% below the national average. This makes the area relatively affordable for renters.
From 2008 to 2024, Rockford, IL's overall cost index changed by -4.5 points (from 96.7 to 92.2). The cost of living has been declining.
The priciest category in Rockford, IL is goods at 93.6, 6.4% below the national average, still the highest of the three categories. The most affordable category is rents at 70.1, 29.9% below average.
Metros with the most similar overall cost index include Tyler, Memphis, Twin Falls. These areas have RPP values within a few points of Rockford, IL's 92.2.

Every figure on PlainCost is rendered directly from BEA Regional Price Parity source data, no number is typed in by an editor. See our editorial standards & corrections policy, the methodology behind these numbers, our changelog, or report a data error. Data current as of 2026-08-11. Rankings measure the published cost-of-living index only; we don't recommend where to live or rate any metro's quality of life.